loader image

CC TrendPro in action

Video Tutorials

A step-by-step guide of all the features encompassed within the CC TrendPro

The most in-depth Tutorial to date which includes everything (except the Early Entry Signals) as well as our own personal 2 account strategy

NEW Power Signals and Supply & Demand Zones Tutorial

Video Tutorial - Trend Bars & Dots

Video Tutorial - Cloud

Video Tutorial - TrackLine & PowerTrend

Video Tutorial - Reversals

Video Tutorial - Significant Volume Indicator

CC Trend Pro

CC Trend Pro is a powerful and sophisticated multi-timeframe, all-in-one indicator which analyses data from the High Timeframes (HTF) down to the Low Timeframes (LTF) and visually represents the overall conditions and possible direction of the Market simultaneously across the board, meaning that no matter what timeframe you look at you will see the same data. If for example the overall market conditions are Bullish (meaning the price of the asset is likely to rise), this will be represented on all timeframes in the same way, so you always have an up-to-date accurate reading of the market.

The reasoning behind this is that generally speaking it is not advisable to be opening Long positions when the overall market is in a Strong Down Trend, as there is no telling how far price will drop – doing so is sometimes referred to as “catching a falling knife”. Likewise, you do not want to be opening Short positions when the overall market is in a Strong Up Trend, as there is no telling how far price will rise. In general, most profits are made when “riding the trend” – i.e. taking trades in line with the overall market conditions.

 CC Trend Pro acts as a timely reminder on each and every timeframe of what the big picture of the market is, helping you avoid bad decisions and assisting you in choosing only the highest probability trades / investments, with the odds stacked in your favour in multiple ways

CC Dots


  • Green Dots = Bullish Micro-Trend – essentially it indicates that the short-term Trend is Bullish, meaning that price is likely to rise in the next few hours. We strongly recommend not opening any short positions if the Dots are Green.
  • Red Dots = Bearish Micro-Trend – essentially it indicates that the short-term Trend is Bearish, meaning that price is likely to drop in the short-term in the next few hours. We strongly recommend not opening any long positions if the Dots are Red.

The Dots tend to be the first sign of a new trend emerging. Their duration is also usually less, as the markets constantly fluctuate – switching, sometimes very quickly, between short term up trends and short term down trends.

Price does not move in a straight line: Even in a Strong Up Trend there will be small short-term down trends. Likewise, in a Strong Down Trend there will be small short-term up trends.

CC PowerTrend

The CC PowerTrend (light blue / red line) is very similar to the CC Track Line, just faster and more responsive, showing slightly shorter-term trend direction. It is actually medium-term and is usually the 2nd sign that a new trend has begun.

It can be used to determine actual entries, especially when combined with the CC Track Line. When these two are in sync you are almost guaranteed a great move.

When price crosses above the CC PowerTrend Line we are looking for Buy or Long opportunities

Conversely, when price crosses below the CC PowerTrend Line we are looking for Sell or Short opportunities

When used in conjunction with the other CC Trend Pro features, and especially with the Dots, it is an extremely powerful tool, providing excellent entries.

In true CC spirit, the CC PowerTrend is multi-timeframe, meaning that it is generated irrespective of timeframe, so for example, even if you are looking at the 3 minute chart the PowerTrend will be showing you data from the higher timeframes.

This helps tremendously to keep you informed and aware of the overall Market Conditions at all times, without having to keep switching between timeframes.

CC Cloud

The shape of the cloud is based on that of Bollinger Bands, which is useful in itself. However, 3 separate complex multi-timeframe algorithms run in the background to actually create the parameters for the Cloud to appear – or not – depending on medium-term market conditions.


Green Cloud = when all parameters have been met, the Indicator generates a Green shaded background indicating that a Bullish Super Trend has begun and that strong buying power is entering the market. In combination with Green Bars (or even Light Blue Bars) it is extremely powerful, allowing for excellent Long entries.

Red Cloud = when all parameters have been met, the Indicator generates a Red shaded background indicating that a Bearish Super Trend has begun and that strong selling power is entering the market. In combination with Red Bars (or even Orange Bars) it is extremely powerful, allowing for excellent Short entries.

The CC Cloud shows medium-term Trend and is usually the 3rd sign that a new trend has started. Explosive moves do not happen unless the CC Cloud is present, with coinciding Dots.

CC Trend Bars

Green Bars = Strong Bullish Up Trend

Red Bars = Strong Bearish Down Trend

Light Blue Bars = Weak Up Trend. This can either mean that the market is turning Bullish if it has been in a Down Trend OR that the market is losing Bullish momentum if it has already been in an Up Trend until this point.

Orange Bars = Weak Down Trend. This can either mean that the market is turning Bearish if it has been in a Up Trend OR that the market is losing Bearish momentum if it has already been in an Down Trend until this point

Generally speaking the Orange and Light Blue Bars are meant to show that the market has entered a transitionary phase.

Due to the fact that the Trend Bars are calculated based on High Timeframe analysis they are the slowest and least responsive of all the algorithms – this can mean that they are sometimes late to the party.
However they are an extremely useful tool for determining the overall conditions of any Market and Strong Up Trends (Bull Markets) do not happen unless Green Trend Bars are present. Similarly,
Strong Down Trends (Bear Markets) do not happen unless Red Trend Bars are present.

CC TrackLine

The CC Track Line is a specially designed Moving Average which is used to determine Trend

When price is above the Track Line, the Line appears Green, the market is considered to be in an Up Trend and this is where explosive moves to the upside tend to occur.

Conversely, when price is below the Track Line, the Line appears Red the market is considered to be in a Down Trend and this is where explosive moves to the downside tend to occur.

When used in conjunction with the other CC Trend Pro features (Bars, Dots, Cloud and PowerTrend) it is an extremely powerful tool, providing excellent opportunities to catch the next big trend.

In true CC spirit, the CC Track Line is multi-timeframe, meaning that it is generated irrespective of timeframe, so for example, even if you are looking at the 3 minute chart the TrackLine will be showing you data from the higher timeframes.

This helps tremendously to keep you informed and aware of the overall Market Conditions  at all times, without having to keep switching between timeframes.

CC Pro+

CC Reversals

CC Pro+ adds yet another dimension to the CC Trend Pro Indicator – identifying potential Reversals in the market, both minor and major, on All Timeframes.


Reversal signals (R) with corresponding Reversal Bars

We have added an algorithm which identifies specific candles where price is likely to reverse. The algorithm then automatically changes the colour of these candles and generates a Bullish (turquoise) or Bearish (red) Reversal signal (R).

Reversals, especially on lower timeframes tend to appear before Dots change colour, meaning that they are the fastest and most responsive of all the CC features. For that reason they are less reliable and we strongly advise against taking trades based just on the Reversals.

* The Reversal Signals are NOT multi-timeframe, they appear accordingly on whichever chart timeframe is being used. This is due to the fact that there are many different styles of trading. For example, a trader might want to see the overall market conditions which are represented by the other CC Trend Pro features, but then actually enter a trade based on a Reversal Signal on the 3 minute timeframe, or the 5 minute or the 15 second etc. Or they might want to check to see if the Weekly or Monthly has printed a Reversal before making a decision.

CC Volume

CC Volume essentially shows explosive Buying or Selling volume entering the market


Normal volume is filtered out so you only see significant volume


Green = Significant Buying Volume

Red = Significant Selling Volume

Orange = Extreme Volume (above 0 line = Buying Volume, below 0 line Selling Volume)


* The CC Volume, like the Reversals, is NOT multi-timeframe, it appears accordingly on whichever chart timeframe is being used. This is again due to the fact that there are many different styles of trading. For example, a trader might want to see the overall market conditions which are represented by the other CC Trend Pro features, but then actually enter a trade based on the Volume on the 3 minute timeframe, or the 5 minute or the 15 second etc.

Early Entry Signals

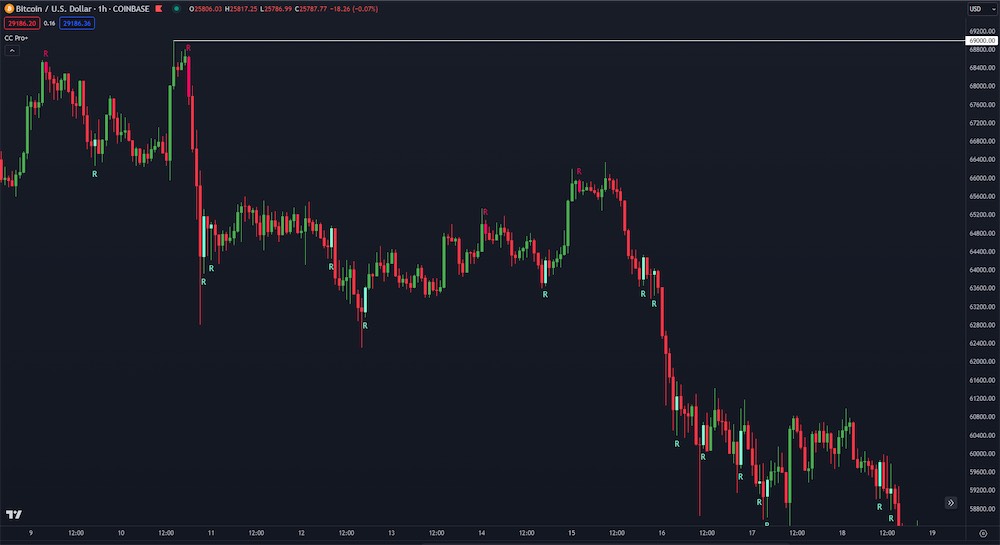
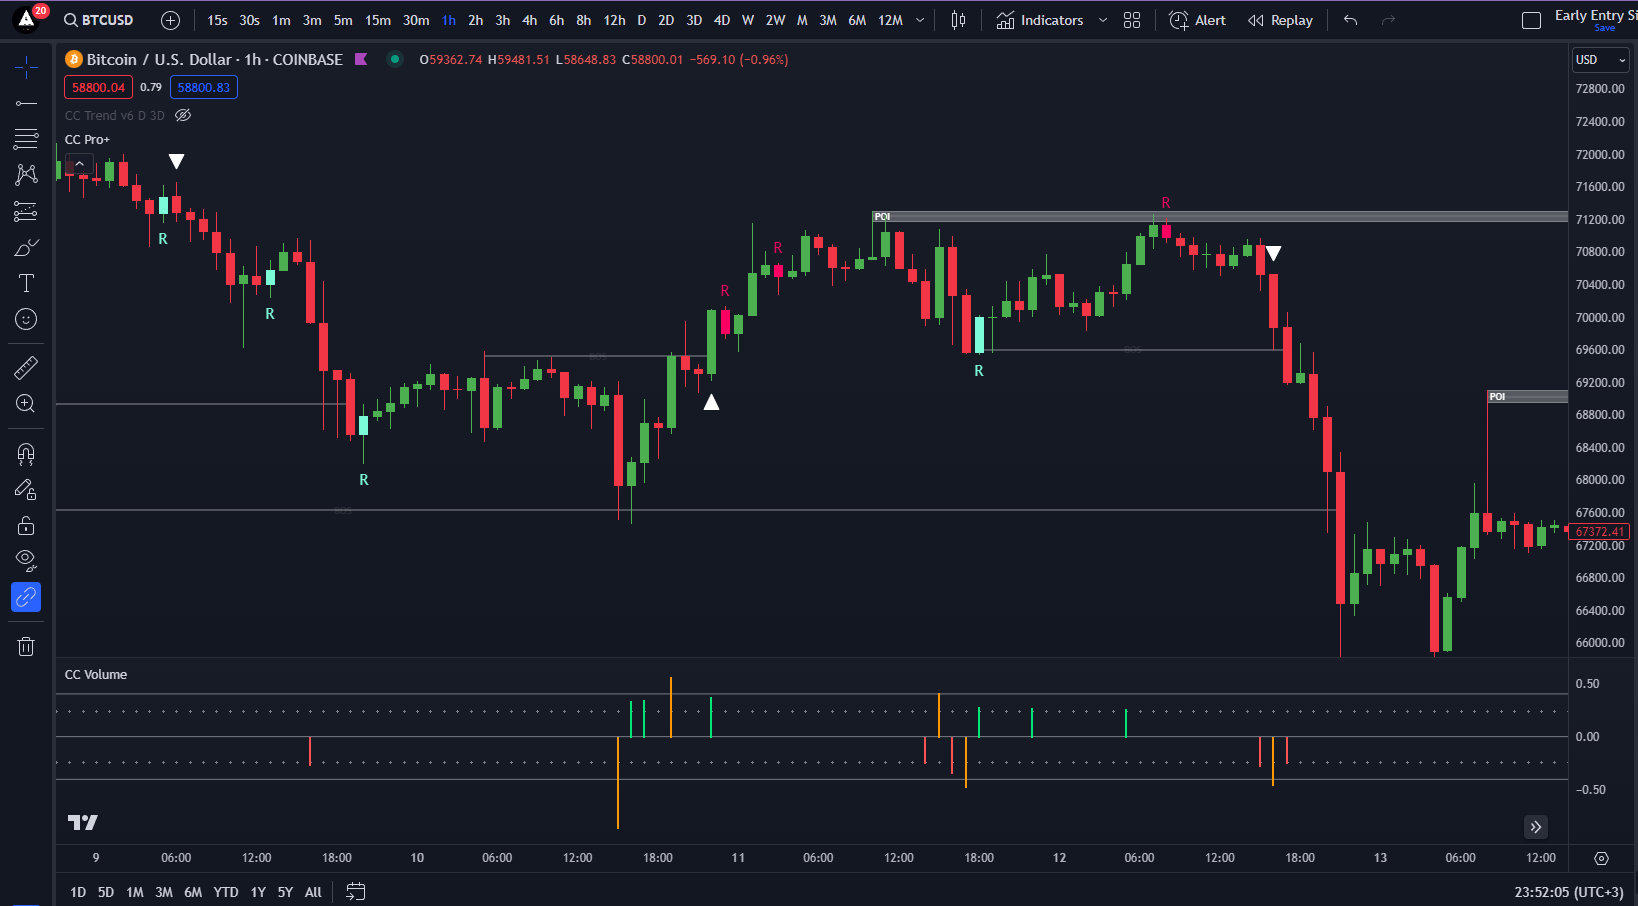
The Early Entry Signals are depicted as White Triangles.

As the name suggests, these signals are designed to get you in earlier as the trend is beginning to start.

They are much more responsive and act more like scalp signals, tending to give smaller faster and much more frequent moves.


🆘 They show up on the 1H 2H 3H and 4H timeframes 


⚠️ Careful as the downside to attempting to catch a trend early is MUCH HIGHER RISK ‼️ 


These are for more advanced traders and you should only use them with additional confluence like Volume, Key Levels, after a Power or Secondary signal etc . and do NOT forget to set a stop loss, especially with these ones‼️ ⛔️ 


🆘 Also feel free to simply turn them off as they WILL clutter the chart and can be annoying, and then maybe turn them on only as you are thinking of entering, for confirmation.


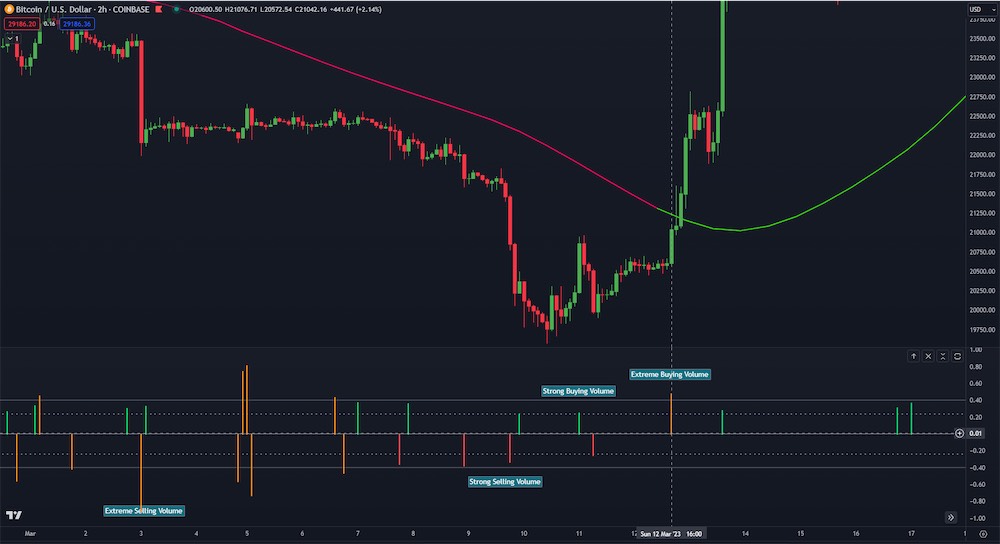
🆘 🆘 I only take a trade if I have Volume on my side  (usually on the 1-2H timeframes)


Used correctly though they can be very useful indeed